From September 25 to 28, 2023, the Digital History Working Group at Bielefeld University welcomed participants to the Digital Academy, themed "From Uncertainty to Action: Advancing Research with Digital Data." This event delved into the complexities of data-based research, exploring strategies to navigate uncertainties within the Digital Humanities. In a series of blog posts, four attendees of the workshop program share insights into their work on data collections and analysis and reflect on the knowledge gained from the interdisciplinary discussions at the Digital Academy. Learn more about the event visiting the Digital Academy Website.
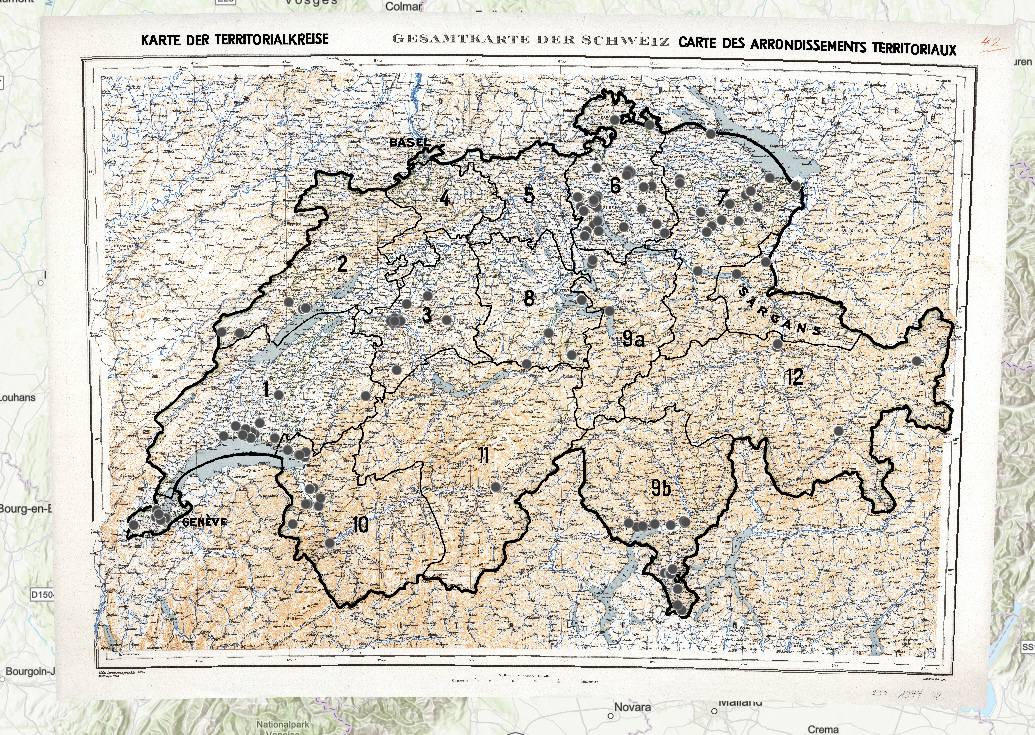
Historical Map of Switzerland.
Swiss military refugee camps
In my research project I examine the Swiss policy of asylum and the military camps for refugees during the Second World War. In this blog post, I thereby focus on the data I collected on these refugee camps and the questions of uncertainty within my work with the data. I encountered uncertainty primarily in the areas of incomplete data, the standardisation process and different data qualities. I will first give a short introduction to my research topic and will then discuss the sources and data I collected. I will thereafter focus on my work with the data, the challenges I encountered when dealing with uncertainty and the benefits I took away from the Digital Academy.
Refugee aid is a civil task. As I focus on military support, I consequently deal with a temporary, exceptional phenomenon. In Switzerland, first the private refugee aid organisations and then the department of police were responsible for the refugees. From 1940 onwards the department of police opened camps to home the refugees and emigrants who sought protection in Switzerland. In the late summer of 1942 the number of refugees was constantly rising. More and more, the civil administration was overstrained. It could neither provide enough space for housing, nor enough financial support, food and staff. Briefly said, the system of civil refugee camps was in danger to collapse. In this situation, the military was asked to stand in. The army was considered to be the only institution that could acquire enough buildings, recruit enough personal and provide a sufficient system for replenishment.
In September 1942 the first reception camp lead by the military was established in Geneva. The army took over the first care for the refugees with food, clothing and accommodation. From that point of time, a new system of three different camps lead by the military was established, that every refugee hat to go through, before being placed constantly in a refugee camp under civil administration. Collecting camps where placed next to the boarder. Due to concerns for hygiene, the refugees were obliged to spend three weeks in a quarantine camp. After the quarantine, the refugees could theoretically move to civil camps but most of the refugees had to stay in reception camps because there was no space for them under the civil administration. Some of the refugees had to stay only for a few days or weeks, others spent months in reception camps. These military refugee camps are the topic of my research. They operated until after the end of the war.
Serial sources as data
Besides the administrative sources like commands and instructions, protocols of inspections and meetings, and weekly reports from the camps are stored in the Swiss federal archives. These serial sources are the basis of my data analysis. I found them in eleven different archive collections. I extracted the information out of the reports into a database. All in all, I found reports on 168 weeks, from October 1942 to July 1946. Nevertheless, the thereby combined collection contains voids. For at least eleven weeks no reports were to be found. It is at least eleven because the first report dates on the 18th of October 1942. However, first camps were opened in September 1942. I am not aware of earlier reports as I could not find any. But it is also possible that the standardised reporting started only in the middle of October. The voids are one aspect of uncertainty I will focus on in this blog post. I aim at being transparent about the gaps and make them visible at all stages of processing.
During the process of data cleaning, I decided to work only with data that refers to one or more refugee in a camp. Data with no refugees or camps that were emptied and only on reserve are therefore not included in the dataset. All in all, I have a dataset with more than 6’000 observations on refugees in the camps. These observations do not only show how many refugees were housed, but also which type of refugees (civilian, military) they were and which type of camp (quarantine, collection, or reception camp) it was. Reflecting on these categories is part of my data critique and leads as well into the field of uncertainty.
The next step was data cleaning and standardisation. I corrected obvious typing errors in the process of data extraction to reduce the number of variables. Then I standardised the camp names. As a subject librarian, dealing with data and meta-data as well as standardising it is part of my daily task. Here are some examples for standardisation with changing names: the camp name “Grand Verger” refers to the same camp as “Signal”. Similarly, the names “Geisshubel” and “Rothrist” refer to the same camp. I put a lot of effort into the standardisation. In the end I found 221 camps. Since one aim of my research project is to depict and analyse the refugee camp system over time, it was important to have a data set as clean and reliable as possible as a basis for the analysis. The various standardisation steps were important for data quality, as the quality of the entire analysis depends on it.
Handling data and uncertainty
To take a step further and to focus on questions about living in the camps during the analysis, I enriched my data with information about the building type and the exact georeference. My approach to deal with the uncertainty I encountered when collecting geodata for every camp to analyse and visualize it in a geographic information system (GIS) to show the geographical distribution, was triangulation by other source types. Sources that contained the necessary information were reports, protocols, autobiographies etc. I also used historical maps provided by swisstopo1, to localise the camps. In many cases the information was good: “factory building 500 metres outside the village” or “Hotel up on a hill between this village and the other”. I could then add the exact geodata. For other camps, the information was not as precise as I had hoped for, and I had only the name of the village. In other cases – most of them were hospitals, prisons, or camps that were only open for a short time. But the location was always within the borders of the territorial district. So I made a sound decision for these camps. For one entity without any information, not even the district, I decided to not georeference it at all.
As I am working as a librarian, I am used to the convention of coding the quality of the metadata. In a library catalogue you can check the level of cataloguing, whether the book was catalogued by a librarian or a machine for example. Having varying qualities of data in my set, I aimed at qualifying it. I therefore went for three different categories: A B and C to make a statement on the accuracy of my data. If someone wants to use my data later, the uncertainty is made transparent through this code. A stands for the best quality, i.e. information about the address at the level of the building. B stands for medium quality; the information is correct at the village or town level. C stands for the most uncertain category, the information is provided within the territorial district and is based on variant indications.
I now come back to the missing reports mentioned above. My goal is to be transparent about this gap. However, making this gap visible in statistics and visualisations is one of the greatest challenges when dealing with uncertainty. Statistics and visualisations are positivistic: they only show what is there. In the first statistics, the gaps weren’t visible. I therefore made artificial observations in my dataset with a zero as value to mark the gaps. In other words, I made the missing weekly reports visible by creating an observation for each of these dates. I have labelled these artificial observations as such. My data model now provides a field to mark whether there is a report for the week or not. Nevertheless, it’s almost impossible to visualise the weeks without information. Although I have made artificial entries in my dataset, these are not displayed in the visualizations because they do not contain a value.
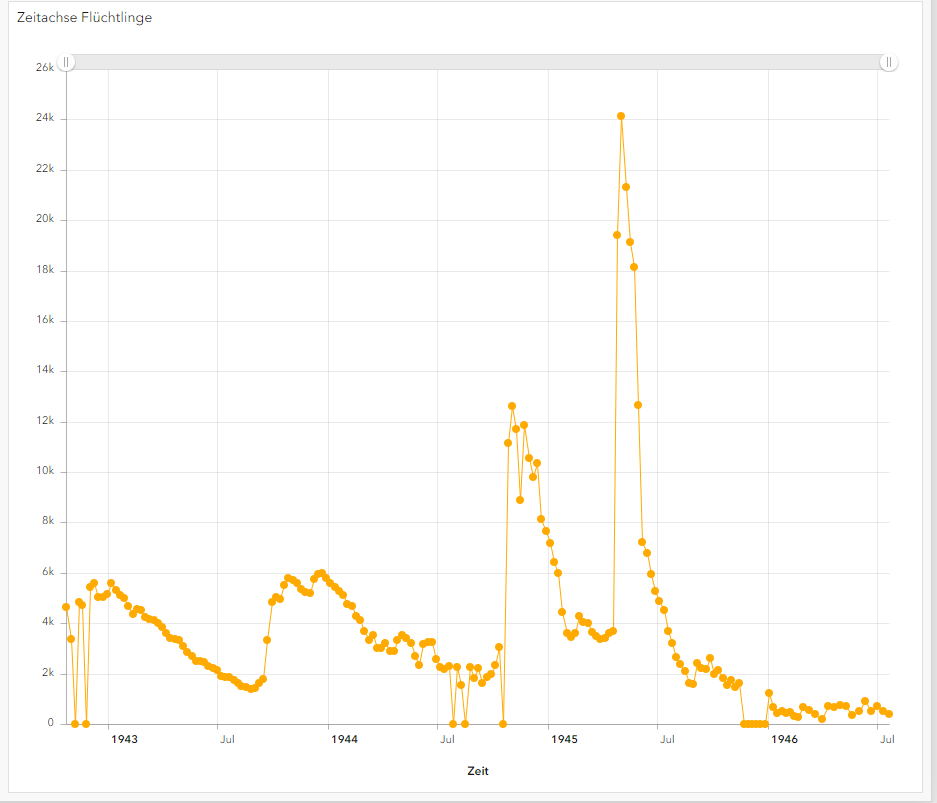
fig. 1: Timeline with missing data
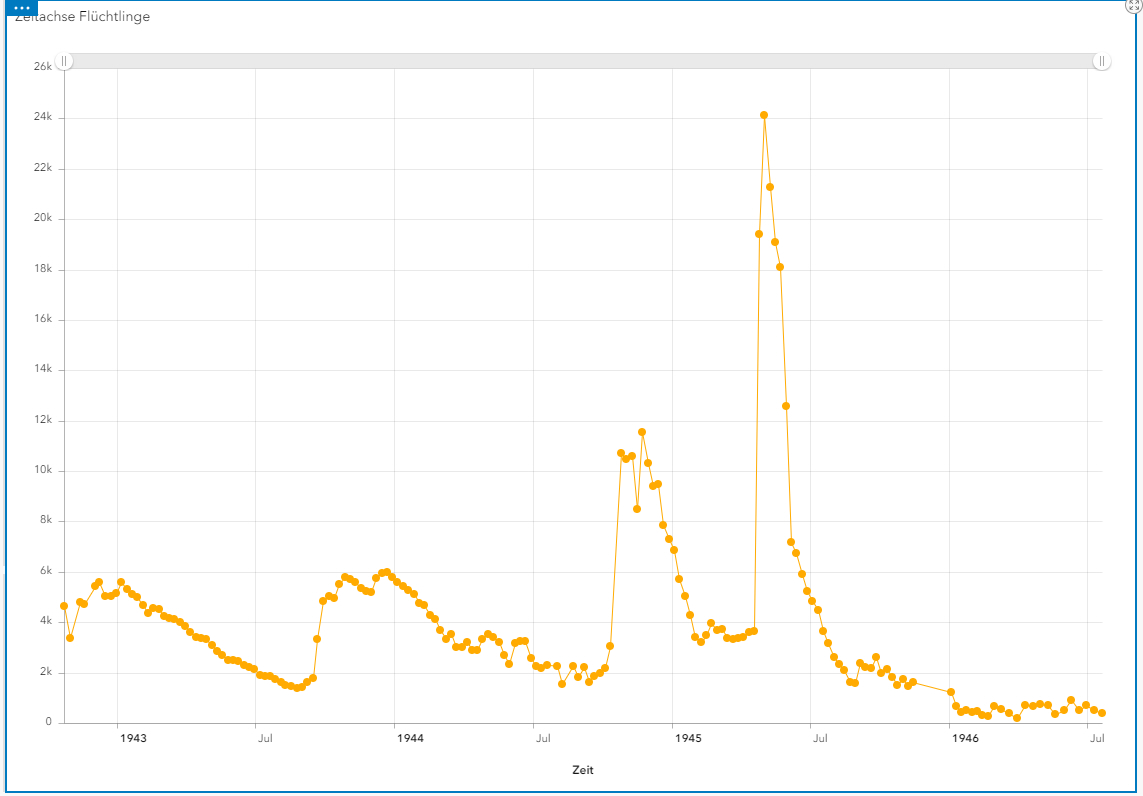 fig. 2: Auto-corrected timeline
The software I use calculates out all uncertain data and provides the average. I found a way to work around this by only using the edit mode, even for my visualisations because in the viewing mode, the observations inserted by me to show the uncertainty will be removed. In both examples, I was able to incorporate the uncertainty into the data via a categorisation in my data model. In this way, I also hope that my data can be better reused, as it makes transparent statements about its own quality.
The workshop of the Digital Academy 2023 gave me the impetus to take a closer look at the subject of insecurity. The opportunity to exchange ideas with other researchers was very enriching. I was also able to present how I deal with uncertainty and develop an even clearer definition of my categories and my approach based on the discussions and comments in the workshop.
Biographical note
Catrina Langenegger recently submitted her PhD thesis on refugee camps under military control in Switzerland during the Second World War. She conducts her research at the Centre for Jewish Studies at the University of Basel. As a historian with a focus on digital humanities she exercises her passion for data also in her role as subject librarian with a background in library and information sciences.
References:
1. Cf. Karten der Schweiz - Schweizerische Eidgenossenschaft - map.geo.admin.ch: https://map.geo.admin.ch/?topic=swisstopo&lang=de&bgLayer=ch.swisstopo.pixelkarte-farbe&catalogNodes=1392&layers=ch.swisstopo.zeitreihen&time=1864&layers_timestamp=18641231.